5 · Seeing and exporting the data
About 30 minutes
Photo: Wellcome Collection via Wikimedia Commons, CC BY 4.0.

By the end of this chapter you'll have a researcher dashboard and one-click CSV and JSON exports.
Your data in admin
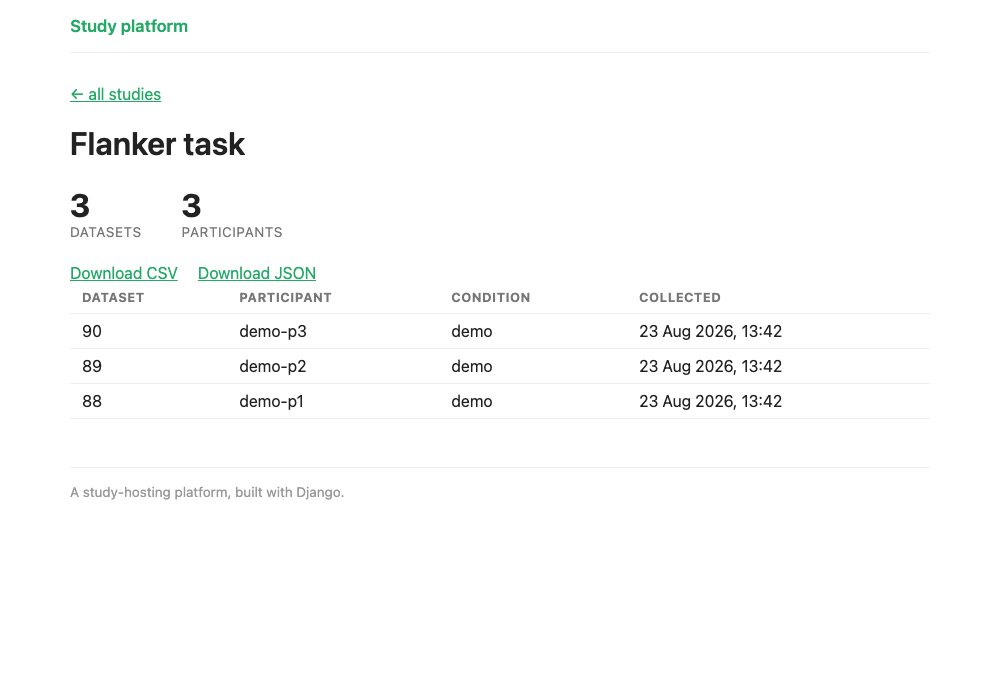
The data is in the database. You can see it in the admin section. You registered StudyData back in chapter 4 (below is an excerpt of the code you already added; there's nothing to change), so you have this ability already!
@admin.register(StudyData)
class StudyDataAdmin(admin.ModelAdmin):
    list_display = ["id", "study", "participant", "condition", "created"]
    list_filter = ["study", "condition"]
Your data, pretty
Let's create a purpose-built dashboard and an export tool, which are friendlier than the admin.
These pages are staff-only
The dashboard and both exports show participant data, so they're not public. Each view
is decorated with @staff_member_required, which redirects anyone who isn't a logged-in
staff user to the admin login first.
The dashboard
These views need some more imports. Make the top of study/views.py read:
import csv
import json

from django.contrib.admin.views.decorators import staff_member_required
from django.http import HttpResponse, HttpResponseBadRequest, JsonResponse
from django.shortcuts import get_object_or_404, render
from django.views.decorators.http import require_POST

from .jspsych import plugin_files
from .models import Participant, Study, StudyData
Now add the dashboard view to study/views.py:
@staff_member_required  # participant data is not public: only logged-in staff may view it
def dashboard(request, slug):
    """A simple researcher view of the data collected for one study."""
    study = get_object_or_404(Study, slug=slug)
    datasets = study.datasets.select_related("participant").order_by("-created")
    context = {
        "study": study,
        "datasets": datasets,
        "n_datasets": datasets.count(),
        "n_participants": Participant.objects.filter(datasets__study=study).distinct().count(),
    }
    return render(request, "study/dashboard.html", context)
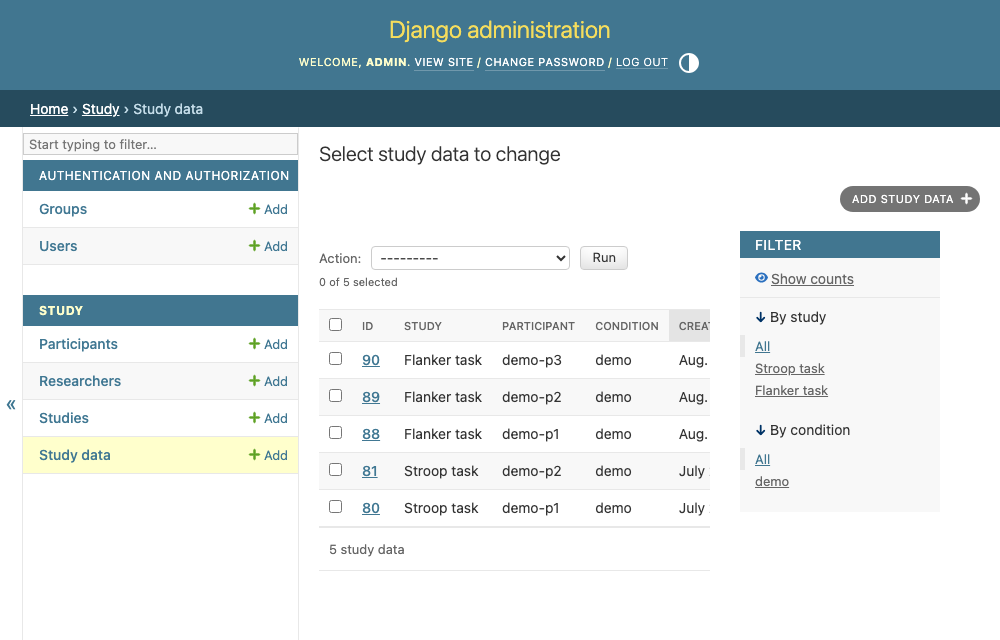
The dashboard view above counts datasets and participants for one study, and lists the datasets.
Note that we use select_related("participant") to fetch each dataset's participant in the same query, instead of one extra query per row (which can really slow things down).
It renders a template. Create study/templates/study/dashboard.html:
<!DOCTYPE html>
<html lang="en">
<head>
    <meta charset="utf-8">
    <title>{{ study.name }} data</title>
</head>
<body>
  <h1>{{ study.name }}</h1>

  <p>{{ n_datasets }} dataset{{ n_datasets|pluralize }} from {{ n_participants }} participant{{ n_participants|pluralize }}</p>

  <p>
    <a href="{% url 'study:export_csv' study.slug %}">Download CSV</a>
    <a href="{% url 'study:export_json' study.slug %}">Download JSON</a>
  </p>

  <table>
    <thead>
      <tr><th>Dataset</th><th>Participant</th><th>Condition</th><th>Collected</th></tr>
    </thead>
    <tbody>
      {% for dataset in datasets %}
        <tr>
          <td>{{ dataset.pk }}</td>
          <td>{{ dataset.participant.external_id|default:"–" }}</td>
          <td>{{ dataset.condition|default:"–" }}</td>
          <td>{{ dataset.created|date:"j M Y, H:i" }}</td>
        </tr>
      {% empty %}
        <tr><td colspan="4">No data collected yet.</td></tr>
      {% endfor %}
    </tbody>
  </table>
</body>
</html>
study/templates/study/dashboard.html on GitHub
pluralize adds an "s" unless the number is 1. {% for %} repeats its rows once per dataset, and {% empty %} covers the case where
there are none yet. The screenshot at the top of the page is the finished app's version,
which adds some styling through a shared layout (see
Sharing page layout in Going further).
Export to CSV
Another view for study/views.py. The helper _csv_cell at the bottom of the block goes in too:
@staff_member_required  # exports contain participant data, so they are staff-only too
def export_csv(request, slug):
    """Export every trial for a study as one CSV row per trial.

    We build the header rows from the unique combination of keys present in the data.
    """
    study = get_object_or_404(Study, slug=slug)
    # The database stores one row per *run* (a StudyData holding the whole JSON blob); the
    # CSV is the other way round, one row per *trial*, the long format R and pandas expect.
    # So further down each dataset needs to become several rows.

    datasets = list(
        study.datasets.select_related("participant").order_by("created", "id")
    )

    # jsPsych records different fields for different paradigms, so build the column set
    # from the union of keys across every trial in every dataset.
    data_keys = sorted(
        {k for d in datasets for t in d.data if isinstance(t, dict) for k in t}
    )
    # ``trial_row`` is this exporter's own counter, the trial's position in the run, so the
    # long format doesn't lose the order the trials arrived in. It's deliberately not
    # called ``trial_index``: jsPsych records a ``trial_index`` of its own (the trial's
    # place in the timeline), and that arrives as a data key below. The two usually agree,
    # including when a timeline loops. Filtering out trials before posting can make them
    # differ, so each gets its own column rather than one clashing with the other.
    base_cols = ["dataset_id", "participant_id", "condition", "collected", "trial_row"]

    response = HttpResponse(content_type="text/csv")
    response["Content-Disposition"] = f'attachment; filename="{slug}_data.csv"'
    writer = csv.writer(response)
    # The headings pass through _csv_cell too: data_keys come from submitted trials, so a
    # hostile trial key of "=..." would otherwise become an executable heading.
    writer.writerow([_csv_cell(col) for col in base_cols + data_keys])
    for d in datasets:

        participant_id = _csv_cell(d.participant.external_id if d.participant else "")
        condition = _csv_cell(d.condition)
        collected = d.created.isoformat()
        for trial_row, trial in enumerate(d.data):
            row = [d.pk, participant_id, condition, collected, trial_row]
            # A trial field can itself be nested (a list or dict, e.g. a response array),
            # to any depth. We don't explode that into more columns; we keep the whole
            # subtree in one cell as a JSON string (see _csv_cell). Left to itself the csv
            # module would str() a Python list to "['f', 'j']" — single quotes, not valid
            # JSON — which no JSON parser will read back. json.dumps writes ["f", "j"]
            # instead, so the cell re-parses cleanly with fromJSON() in R or json.loads in
            # pandas, where you can unpack the nesting knowing which question it came from.
            row += [_csv_cell(trial.get(k, "")) if isinstance(trial, dict) else "" for k in data_keys]
            writer.writerow(row)
    return response


def _csv_cell(value):
    """Render one externally-sourced value for a CSV cell.

    Nested values (e.g. a response array) become JSON so they can be dropped into R or
    pandas. A string a spreadsheet might read as a formula is prefixed with an
    apostrophe, so an opened CSV can't run a participant's ``=...`` answer as a
    calculation (CSV/formula injection); leading whitespace doesn't hide the trigger
    character. Analysis code reading the raw text may need to strip that apostrophe.
    """
    if isinstance(value, (dict, list)):
        value = json.dumps(value)
    if isinstance(value, str) and value.lstrip().startswith(("=", "+", "-", "@")):
        return "'" + value
    return value
Read the comments and you'll see we have one row per trial (long format, popular in modern statistics), with fixed columns over all participants.
Here's what that produces for two participants who did three trials each (simplified: a real Flanker run records more columns):
dataset_id,participant_id,condition,collected,trial_row,correct,plugin_version,response,rt,trial_index,trial_type
1,p01,A,2026-08-18T20:20:01.119282+00:00,0,True,2.1.0,f,412,0,html-keyboard-response
1,p01,A,2026-08-18T20:20:01.119282+00:00,1,False,2.1.0,j,526,1,html-keyboard-response
1,p01,A,2026-08-18T20:20:01.119282+00:00,2,True,2.1.0,f,389,2,html-keyboard-response
2,p02,B,2026-08-18T20:20:01.119452+00:00,0,True,2.1.0,j,603,0,html-keyboard-response
2,p02,B,2026-08-18T20:20:01.119452+00:00,1,False,2.1.0,f,571,1,html-keyboard-response
2,p02,B,2026-08-18T20:20:01.119452+00:00,2,True,2.1.0,j,498,2,html-keyboard-response
Drop unnecessary columns (for analysis anyway!) and the data is easier to digest:
| participant_id | condition | trial_row | response | rt | correct |
|---|---|---|---|---|---|
| p01 | A | 0 | f | 412 | True |
| p01 | A | 1 | j | 526 | False |
| p01 | A | 2 | f | 389 | True |
| p02 | B | 0 | j | 603 | True |
| p02 | B | 1 | f | 571 | False |
| p02 | B | 2 | j | 498 | True |
One row per trial. This is the long format that R and pandas expect.
Two of those columns look similar but most certainly are not. trial_row is where the trial sat in
the data we received, while trial_index comes from jsPsych, which stamps a trial_index value onto every trial
it records (preserving trial order). They normally match, including when a block of
trials repeats. Filtering out trials before posting the data can make them differ, so the export
includes both variables.
Behavioural studies collect arbitrary text, and a free-text answer starting with =, +,
- or @ (even after leading whitespace) could be read as a formula if someone opens the
file in a spreadsheet. So the exporter prefixes those cells with an apostrophe, which a
spreadsheet shows as plain text.
Note that Django typically records times in UTC (see time zones if you want to change that), so it may look a few hours off from your local clock. You can convert to local time in your analysis if you need to.
Export to JSON
CSV flattens every run into trials. JSON keeps each run whole, with its trials nested
inside it, which is handy if you'd rather do the reshaping in R or Python. Add this last
view to study/views.py:
@staff_member_required  # nested JSON export of participant data: staff-only
def export_json(request, slug):
    """Export a study's data as JSON: one entry per run, each with its trials."""
    study = get_object_or_404(Study, slug=slug)
    datasets = study.datasets.select_related("participant").order_by("created", "id")
    payload = [
        {
            "id": d.pk,
            "participant_id": d.participant.external_id if d.participant else None,
            "condition": d.condition,
            "created": d.created.isoformat(),
            "trials": d.data,
        }
        for d in datasets
    ]
    response = JsonResponse({"study": study.slug, "datasets": payload})
    # Download rather than display in the browser, like the CSV.
    response["Content-Disposition"] = f'attachment; filename="{slug}_data.json"'
    return response
Wire up the URLs
None of these three views has an address yet. Add them to the urlpatterns list in
study/urls.py:
    path("study/<slug:slug>/dashboard/", views.dashboard, name="dashboard"),
    path("study/<slug:slug>/export.csv", views.export_csv, name="export_csv"),
    path("study/<slug:slug>/export.json", views.export_json, name="export_json"),
The dashboard template links to the exports by these names, so all three need to be there before the dashboard will load.
Checkpoint
Run the study a couple of times, then open /study/flanker/dashboard/ (you may be asked to log in first, if you have not done so already; the page is staff-only). You'll see the
counts climb and the datasets listed, with Download CSV and Download JSON links
that hand you the data.